Executive summary
- Client: an enterprise software company deciding whether to fund a conversation intelligence platform for its field sales force.
- Problem: the obvious business case, rep time saved, undersold the platform. The larger value came from what thousands of customer conversations would reveal once they were added up, and nobody had a defensible way to put a number on that.
- What we built: a sourced evidence base, a scenario-based financial model with every input tagged by where it came from, an interactive dashboard, an executive narrative, and a presentation deck, all drawing on the same verified numbers.
- Result: in the base scenario, the value of aggregated customer intelligence overtakes the value of time savings by the sixth quarter. The model makes that claim testable instead of rhetorical.
- Status: delivered in August 2026.
The problem
The sponsor had a working discovery conversation platform and needed to justify rolling it out to the whole field sales force. The simple case was efficiency: reps spend hours consolidating each discovery assessment, and the platform cuts that down.
Efficiency is real, but it is capped by headcount and hours. The bigger opportunity was different. Once every discovery conversation is structured and attributed, the company can see across its whole market: which pain points are spreading, where competitors are gaining, which customers are at risk. That kind of value is usually either ignored in business cases or stated as a large number with nothing behind it. Neither holds up with a finance team.
What we built
An evidence base before any model
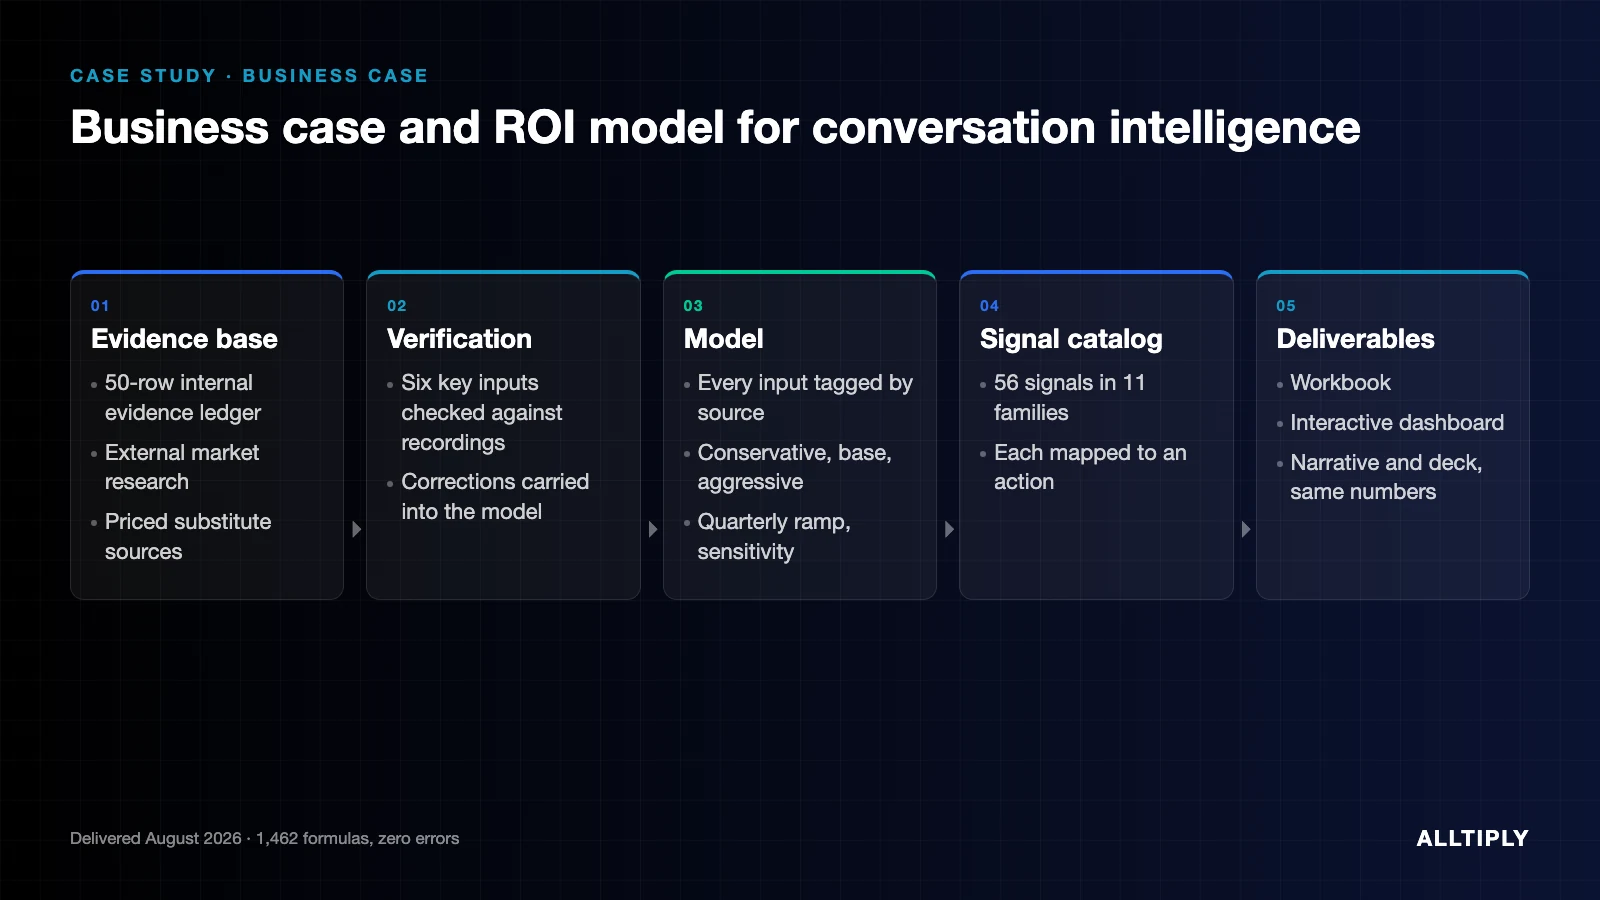
- Internal evidence ledger: 50 rows of scale figures, engagement history, and product metrics mined from the engagement record, each with its source.
- External research: company and market economics, contract and switching dynamics, the priced cost of substitute intelligence sources (conversation analytics, win-loss research, competitive intelligence tools, and analyst research), and precedents showing that aggregated industry interaction data is an established, valuable asset class.
- Transcript verification: six assumptions that drove the model were checked against the actual meeting recordings. Several were corrected. One widely repeated sales-cycle figure turned out to come from an AI meeting summary, not from what anyone said. It was replaced with the range stakeholders actually gave. A time-savings figure that could not be traced to a source was modeled as a range instead of a single number.
A model with visible sources
- Every input is color-coded by where it came from: client-provided, stated in a meeting, externally sourced, or assumed. Assumptions are labeled as assumptions and stress-tested.
- Conservative, base, and aggressive scenarios, each with its own ramp by quarter.
- Value is split into layers: efficiency first, then the intelligence the aggregated conversations produce, then longer-term effects that are shown as ranges and kept separate from the core case.
- A sensitivity chart ranks which assumptions move the result most, which shows the sponsor where to collect better data first.
- A built-in checks sheet. The workbook contains 1,462 formulas with zero errors, and every check passes.
A catalog of what conversations actually contain
To connect conversations to value, the team built a catalog of 56 distinct signals in 11 families. It covers what customers say (pain, competitors, feature gaps, contract terms) and how they say it (engagement over time, silence, changes in sentiment). Each signal is mapped to the action it enables and to the part of the model it feeds. The architecture that turns those signals into executive reporting is written up in From conversation to executive instrument.
Four deliverables, one set of numbers
- The financial model workbook.
- An interactive dashboard with scenario toggles and adjustable, source-tagged inputs. Its calculation engine matches the workbook to within 0.05 percent.
- A 15-page executive narrative with a separable ROI section.
- A 14-slide deck the sponsor can use to make the case internally.
What the model showed
- In the base scenario, the value of aggregated customer intelligence permanently overtakes time savings by the sixth quarter after rollout.
- Adding real client figures for sales headcount and customer base made that crossover come earlier and more cleanly than the first estimate had.
- The weakest link in the revenue math was the assumed rate at which customers switch vendors each year. The model flags it and recommends checking it against the client's own win data before anyone relies on the top-line number.
What we would tell other teams
- Check your inputs against the recordings. AI meeting summaries round, merge, and occasionally invent numbers. If a figure drives your model, find the moment someone actually said it.
- Separate what you can prove from what you expect. Keep hypotheses in their own layer, with their own ranges, so one contested assumption cannot sink the whole case.
- Make every deliverable use the same numbers. If the deck, the narrative, and the dashboard each show a different figure, executives stop trusting all of them.
Related
Need a business case that will hold up with your finance team? Talk to us.
Related services: AI Business Case and ROI Model and Conversation Intelligence.