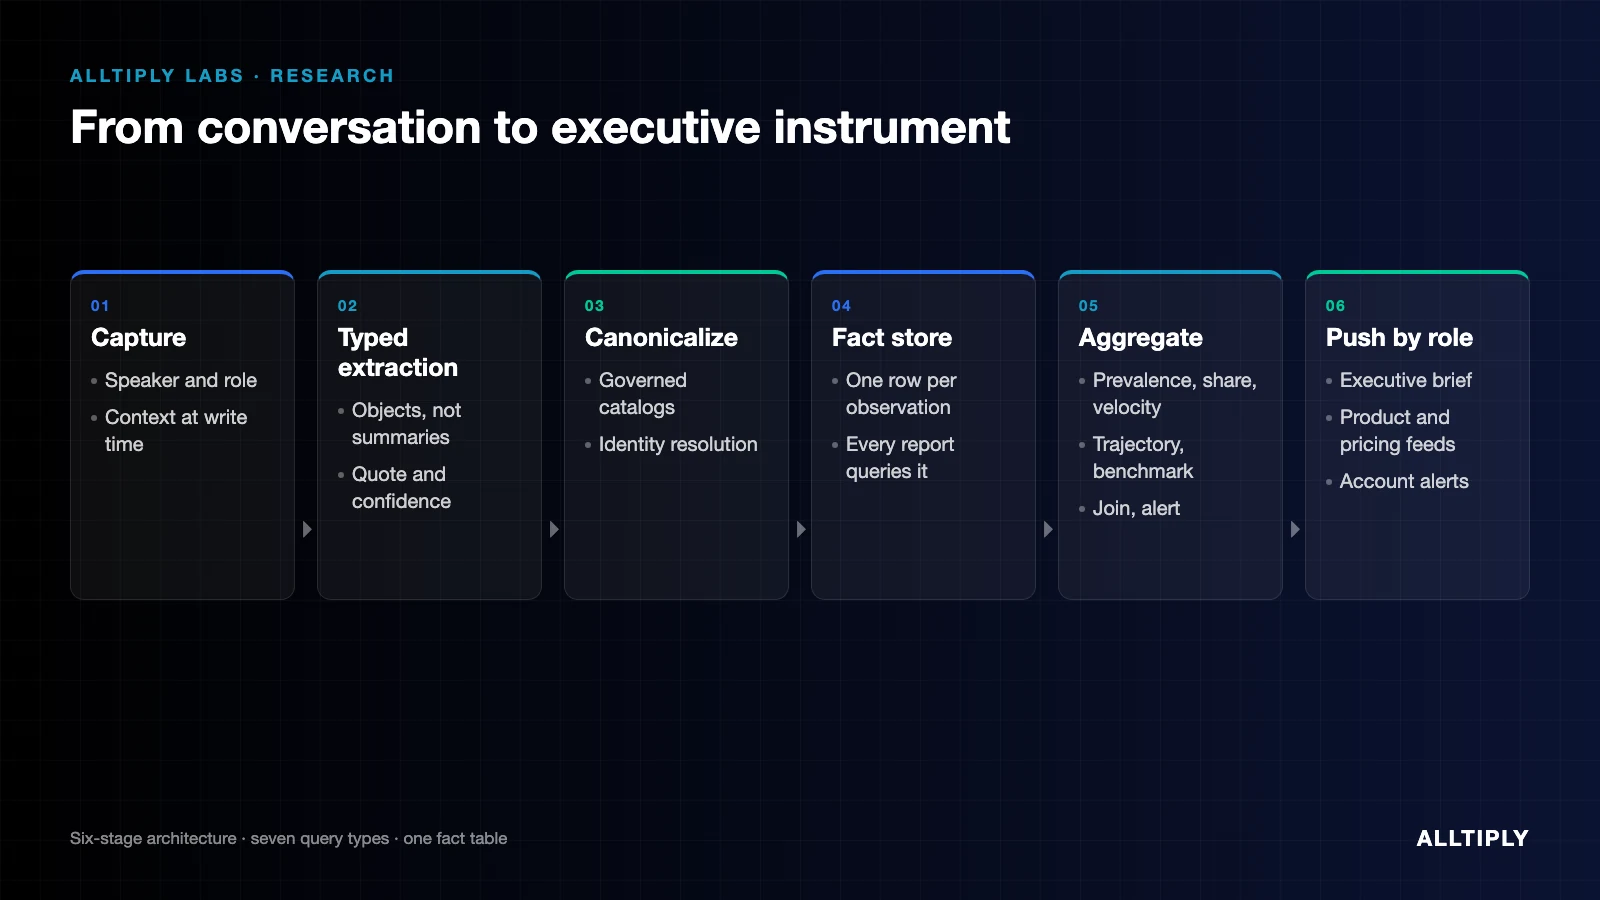
Finding: a conversation intelligence platform becomes useful to executives only after individual conversations are turned into governed, countable facts. The work that matters most is structuring the data, not summarizing it: capture context up front, extract typed objects with evidence, map them onto a controlled vocabulary, and store them in one table that every report queries.
Summary
- Most conversation tools stop at per-call summaries. Summaries do not add up. Executives need counts, rates, trends, and comparisons, each traceable to what a customer actually said.
- We use a six-stage pipeline: capture, typed extraction, canonicalization, a longitudinal fact store, aggregation, and role-specific reporting.
- Almost every executive report is one of seven query types run against the same fact table: prevalence, share, velocity, trajectory, benchmark, join, and alert.
- Executives trust the numbers because of four safeguards: every number links to its evidence, review tiers, coverage scores, and a governed vocabulary.
Where this comes from
ALLTIPLY designed this architecture while building a discovery conversation intelligence platform for an enterprise software company's field sales force, and while preparing the business case for scaling it. The platform's executive demo is a small working model of the architecture described here. Stages 1 and 2 are built, stage 3 is partly built, and the later stages are specified.
What counts as a signal
A topic is not a signal. "Customers talk about competitors" tells an executive nothing they can act on. A signal combines five things:
- a canonical entity (a specific competitor, pain pattern, or feature gap),
- a normalized measure (mentions per 100 conversations, not raw counts),
- a change or threshold (up three times quarter over quarter),
- a named owner (the product team, the pricing desk, a regional sales leader),
- and a recommended action.
"A competitor was mentioned" is an utterance. "Mentions of one competitor per 100 conversations in one region tripled this quarter, mostly among operations managers at multi-location customers, with 14 supporting quotes, so run a targeted proof campaign" is a signal.
The six stages
1. Capture, with context
Transcripts are diarized and each speaker is identified, then tagged at write time with account, department, speaker role, territory, rep, date, prospect or customer, and deal stage. A quote without that context cannot be aggregated later, so this stage decides what every later stage can do.
2. Typed extraction
For each conversation, the model outputs typed objects rather than prose: process steps, pain points with severity, tools and vendors mentioned, stated metrics and financial impacts, claims, and decision points. Each object carries the exact quote it came from and a confidence score, and goes to the rep for review.
3. Canonicalization
This stage turns extracted text into data that can be counted. Every object is mapped to a governed catalog. "We re-key tickets," "double entry between systems," and "typing it twice" become one pain pattern with three pieces of evidence. Three things are needed as volume grows:
- catalogs for every signal family, not just pain points,
- a review queue for new entities, so the catalog grows with the data instead of forcing everything into existing categories,
- and identity resolution, so the same account seen by two reps over five visits counts as one account.
4. The longitudinal fact store
Each canonical observation becomes one row: entity, account, department, speaker role, deal stage, region, severity, stated value, timestamp, evidence, confidence, and review tier. A single row is an anecdote. The whole table shows the market. Every executive report is a query on this one table.
5. Aggregation
Almost every executive report is one of seven query types:
- Prevalence: how many distinct accounts mention an entity, weighted by revenue at stake. Example: a ranked, dollar-weighted list of pain points for the product roadmap.
- Share: how an entity is distributed across a population. Example: installed-competitor share by region.
- Velocity: change in rate over time, per 100 conversations. Example: early warning when a competitor gains momentum.
- Trajectory: the direction of one account across meetings. Example: churn risk, including accounts that go quiet.
- Benchmark: percentile distributions of stated figures by cohort. Example: operating economics by customer size.
- Join: conversation facts combined with another dataset. Example: complaints about a product the customer owns (churn risk) versus one they lack (cross-sell).
- Alert: a threshold or event on any of the above.
6. Role-specific reporting, pushed to people
Executives do not go looking through a data lake, so reports are pushed to them. Each role gets its own view from the same fact store: an executive brief, a feature-gap queue sent to the product backlog, a competitor quote book for pricing, account health alerts for customer success. The executive demo generates a governed weekly regional brief from the data, with recommended actions, instead of relying on an analyst to write it.
Why executives trust it
- Every number links to evidence. Each figure is one click from the quotes behind it, with speaker role, account, and date.
- Review tiers. Rep-approved extractions rank above unreviewed AI extractions, and reports can filter by tier.
- Coverage scores. Every aggregate states its basis, such as 41 accounts and 62 percent of the segment. The demo already enforces minimums before showing a comparison: at least 40 conversations and two supporting records.
- A governed vocabulary. Catalogs are curated, so numbers stay comparable from quarter to quarter.
The joins that make it useful across the company
The conversation layer becomes company-wide infrastructure when it is joined with systems of record. Those systems already show what happened: installs, billing, tickets, pipeline. Conversations add why:
- with install and billing records: churn and cross-sell precision,
- with CRM pipeline: deal health based on what customers said, not what reps logged,
- with support tickets and product usage: accounts that are unhappy but never file a ticket,
- with renewal dates: which accounts to prioritize, ordered by when their renewal is due.
How it scales
- Demo: extraction and review per conversation, normalized rates, a regional brief.
- Pilot, 15 to 50 reps: identity resolution, the catalog review queue, and coverage scores. The fact store becomes real.
- Full field team: the seven query types as standing reports, pushed briefs, alerting, and the first join with systems of record.
- Existing-customer conversations: trajectory signals switch on, and benchmarks reach statistical depth.
- Company-wide: the remaining joins and a feed for each department.
Method and limitations
This is an architecture paper based on one enterprise platform build and business case in 2026. Stages 1 and 2 run in the working platform and stage 3 is partly built. The fact store, full query set, and joins are specified but not yet running at field scale. Anyone building this should expect most of the effort to go into governing the catalogs and resolving identities, not into model choice.
About ALLTIPLY Labs
ALLTIPLY Labs publishes what we learn building AI systems for real organizations. If your conversation data is sitting in transcripts nobody can add up, talk to us.